# Executing Test Cases
vREST provides you with in-depth details of your test case's execution. Let us explore some of these features and functionalities.
# Running Test Cases
In vREST, the only ways to run test cases are as follows:
- Run a single test case
- Run a test suite
- Run all test cases
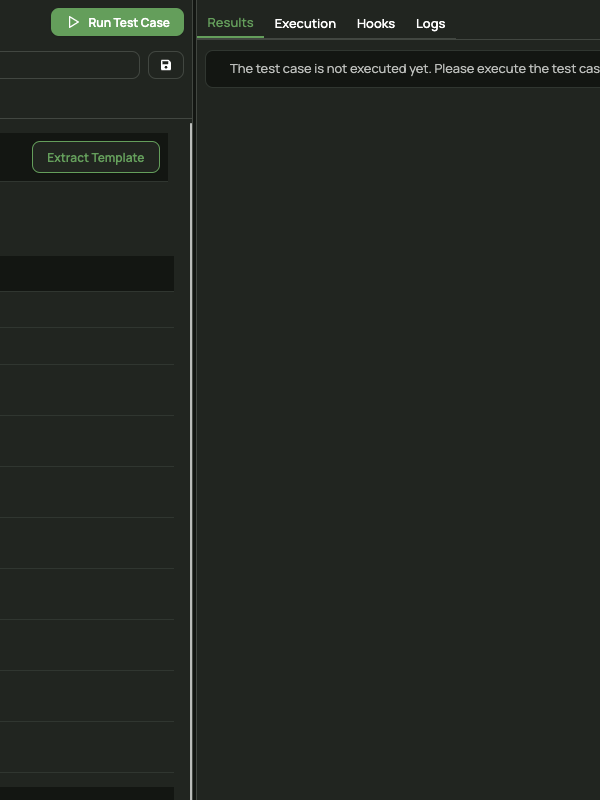
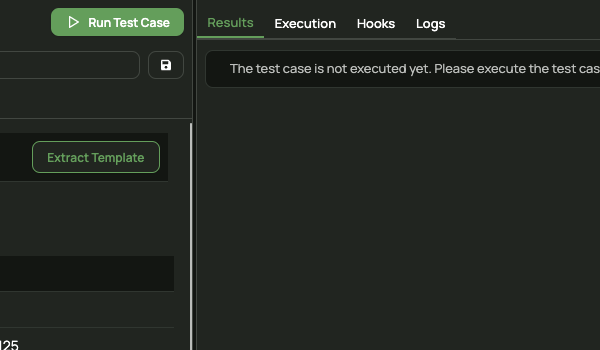
# Run a single test case
To run a test case,
- Open the test case.
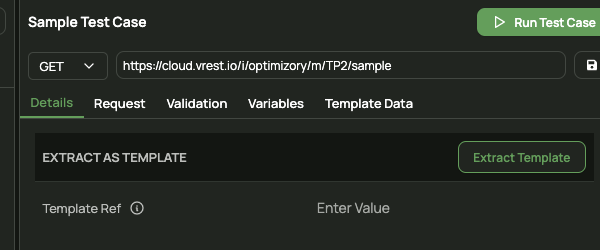
- Click on

# Run a test suite
To run a test suite,
- Select the desired test suite from the sidebar.
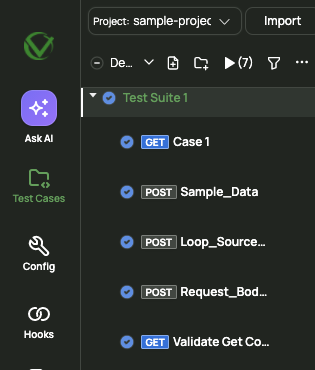
- Click on

# Run all test cases
To run all the test cases,
- Click on
 in the sidebar.
# Analyze and Debug Results
Now that you have run your test cases, it is time to debug the failures and analyze your test case results. So, let us see some of the ways in which you can analyze the running status, diff report, response time, etc. of your test case.
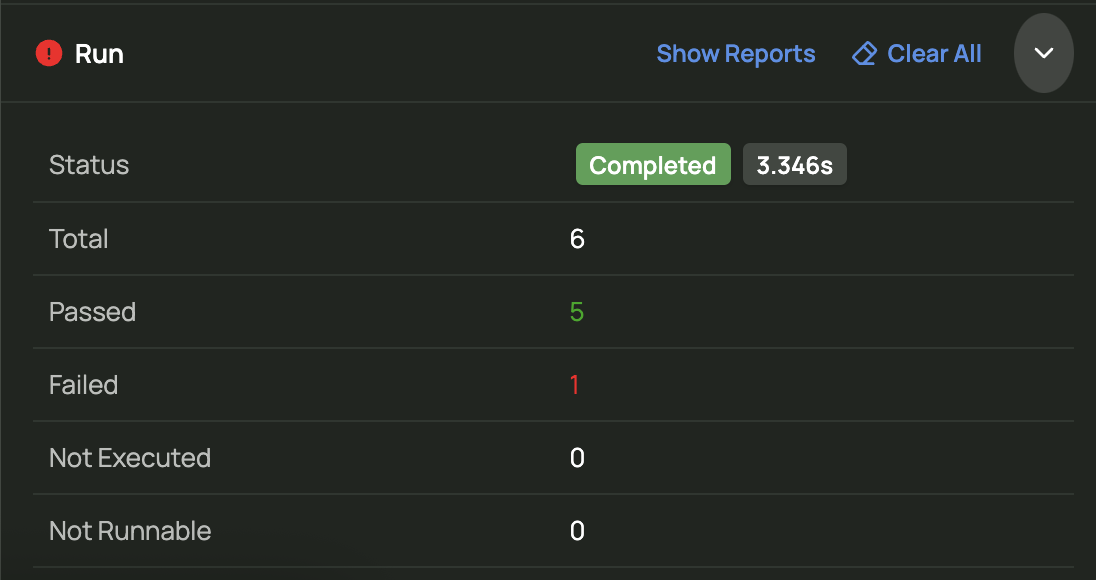
# Running Status
The Running Status of your last run or currently running test cases is being shown in the bottom-left corner of the application.
To see this in action, run any test case in any of the above-mentioned ways and see the running status.
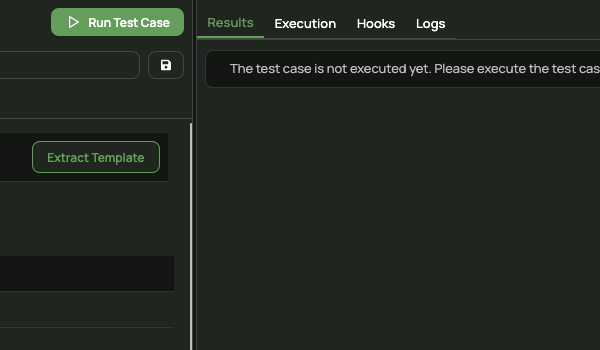
# Results Analysis
To see/analyze/debug your test case's result,
- (After running any test case) See the Results section in the Results Tab.
- You will see all the passed and failed assertions, with their definition.
If you are using Advanced Response Validation you can use the following ways to analyze Results,
Diff Report:
- You can see the Diff Report just below the Results section.
- In the Diff Report, you can see exactly where there is a difference between the actual response body and the expected response body.

Copy Actual to Expected Button:

This button allows you to copy the actual response of the API to the expected body set in your test case. After this, you can go back to your Expected Body and edit it according to you.
Expected vs Actual Response:
- Click on the Expected vs Actual Response sub-tab under the Results Tab.
- You will see the Actual response body and the Expected response body, side-by-side.
If you are using Loop Source in your test case then you can view their every iteration's result by browsing the Iterations section
Iterations
- After your test case (with loop source) is run, view the Iterations section on the top-right side of the application.
- Click on any one of the iterations to see its results below.
# Execution Details
If you have run your test cases and want to see some execution details of each test case then,
- Go to the Execution Tab
- In the Details sub-tab, you can see the URL, Response Time, Status Code, and Actual Response of your API.

- You can also analyze the Request Headers and Response Headers from their respective sub-tabs under the Execution Tab.